Mortgage rate history explained in a single paragraph: In 1981, the average 30-year fixed mortgage rate hit 16.64%. In 2021, it bottomed out at 2.96%. The 2026 year-to-date average through September sits at 6.46%, with recent weekly readings climbing toward 7%. Three data points. Three completely different economic worlds. Understanding mortgage rate history isn’t just a trivia exercise; it’s the single most useful frame a buyer or refinancer can have when deciding whether now is the right time to act. At Isabelle Mortgages, this historical context is exactly what we walk clients through before they make one of the biggest financial decisions of their lives.
Most buyers approach rates emotionally. They compare today’s number to the lowest rate they’ve ever heard of, feel frustrated, and either rush in or freeze up. Neither response serves them well. What actually serves them is perspective: knowing where rates have been, why they move, and what the current landscape means for their specific situation. This article gives you all three.
Mortgage Rate History Explained: The 1980s Rate Shock and How Rates Hit 16%
Freddie Mac has tracked weekly 30-year fixed mortgage rates since April 1971, when the average was 7.54%. What followed over the next decade was the most dramatic rate escalation in recorded U.S. mortgage history. By 1980, the annual average had climbed to 13.74%. By 1981, it peaked at 16.64%. To put that in payment terms: a $200,000 mortgage at 16.64% carried a monthly principal-and-interest payment of roughly $2,800. At today’s rates near 7%, that same loan runs about $1,330.
Why Inflation Was the Match That Lit the Fire
Multiple forces converged to produce that spike. The 1973, 74 Arab oil embargo and the 1979 energy shock drove fuel and production costs sharply higher, contributing to stagflation: high inflation paired with weak economic growth. Vietnam-era fiscal expansion had already built a foundation of demand-side pressure. By 1980, U.S. inflation was running at approximately 13.5%. Lenders responded the only rational way they could: by demanding higher nominal rates to preserve the real value of future loan repayments. When you expect inflation to erode your dollars, you charge more upfront.
The Volcker Fed and the Deliberate Rate Spike
Federal Reserve Chair Paul Volcker chose an aggressive remedy. He restricted money supply growth and drove the federal funds rate from roughly 11% toward 20% in 1980, 81. The December 1980 prime rate reached a record 21.5%. Mortgage rates followed, not because the Fed sets them directly, but because long-term investors demanded yields high enough to compensate for inflation and recession risk. The key distinction: inflation started the climb, but the Fed’s deliberate tightening produced the peak. The pain was severe and a deep recession followed, but by 1983, inflation had fallen to 3.2%, and the long descent in mortgage rates had begun.
The Long Descent: From Double Digits to Historic Lows
What followed 1981 was a 40-year downward trend in U.S. mortgage interest rates, interrupted only by brief periods of tightening. Many buyers who entered the market after 2010 had never experienced sustained rates above 5%, which shaped expectations in ways that are still playing out today.
The Gradual Cooling Through the 1990s and 2000s
After Volcker’s tightening worked, rates fell steadily. By 1993, the 30-year fixed averaged 7.31%. Through most of the 1990s and early 2000s, rates held in the 6%, 8% range, historically normal, though it wouldn’t feel that way now. The mid-2000s brought easier credit and lower rates that helped fuel strong home-price growth, but lax underwriting created the conditions for the 2008 housing collapse. The collapse’s immediate aftermath drove rates lower still, as the Federal Reserve began purchasing mortgage-backed securities at scale to stabilize the market.
The 2008 Crisis and the Era of Sub-3% Rates
When the housing market imploded, the Federal Reserve responded with quantitative easing: large-scale purchases of mortgage-backed securities that flooded the MBS market with demand and pushed rates lower. The 2008 annual average was 6.03%; by 2012, it had dropped to 3.66%, the lowest full-year average on record to that point. The trend continued. Pandemic-era monetary policy pushed the 2020 annual average to 3.11% and then the 2021 average to 2.96%. Rates had never been lower in the entire Freddie Mac reporting history. And that, as it turned out, was the problem.
Mortgage Rate History Explained: The 2022 Reversal and Where Rates Stand in 2026
Rates went from 2.96% in 2021 to a 5.34% annual average in 2022, then 6.81% in 2023, the fastest sustained increase in modern mortgage history. Many buyers felt blindsided. In hindsight, though, the reversal followed a pattern that mortgage rate history makes entirely predictable: inflation returns, the Fed responds, and rates climb.
What Triggered the Sharpest Spike in a Generation
When the Fed began tightening in March 2022 to combat post-pandemic inflation, it raised the federal funds rate by 525 basis points through July 2023. Mortgage rates moved in the same direction, rising approximately 470 basis points over the same period. Simultaneously, the Fed began unwinding its MBS purchases, reducing demand for mortgage-backed securities and widening the spread between mortgage rates and the 10-year Treasury yield. That spread, which averaged about 1.6 percentage points in early 2022, ballooned to roughly 3.2 percentage points by October 2022, a level that reflected not just policy changes but elevated volatility, prepayment risk, and reduced MBS liquidity.
Where Rates Land in 2026 and What That Really Means
The 2026 year-to-date average through September 30 sits at 6.46%, with the most recent weekly Freddie Mac reading at 7.03% as of September 24. That range feels uncomfortable to anyone who refinanced in 2020, 2021. Zoom out across the full Freddie Mac reporting history, which spans more than five decades, and these numbers fall near the long-run series average, which has hovered around 7.7% since 1971. The post-pandemic era of sub-3% rates was the anomaly, an extraordinary convergence of policy choices unlikely to repeat. Framing today’s rates as “high” only makes sense relative to that anomaly, not relative to the full sweep of U.S. mortgage rate history.
What Actually Moves Mortgage Rates: The Mechanics Behind the Numbers
Many buyers assume the Federal Reserve sets mortgage rates. It doesn’t, at least not directly. The Fed controls the overnight federal funds rate, which influences short-term borrowing costs across the economy. But the 30-year fixed mortgage rate is a long-term market rate; its primary driver operates on a different mechanism altogether.
Why the 10-Year Treasury Yield Is the Real Benchmark
The 30-year fixed mortgage rate tracks mortgage-backed securities, which are priced relative to the 10-year U.S. Treasury yield. Research estimates that mortgage rates have roughly 85% sensitivity to changes in the 10-year Treasury yield, compared to only about 20% sensitivity to the federal funds rate. Understanding the term structure of interest rates, how yields differ across short-, medium-, and long-term debt, helps explain why the yield curve, not Fed meeting minutes, is the more reliable signal for where mortgage rates are headed. The long-run average spread between the 30-year mortgage rate and the 10-year Treasury is approximately 1.8 percentage points. As of early October 2026, with the 10-year Treasury near 5.3% and 30-year mortgage rates near 7.3%, that spread has widened to approximately 2.0 percentage points, reflecting ongoing MBS market dynamics and lender risk pricing.
Spreads, Inflation Expectations, and Lender Capacity
Beyond Treasury yields, three other forces push rates up or down:
- Prepayment and refinancing risk: Lenders price in the likelihood that borrowers will refinance when rates fall, which effectively shortens the expected loan duration and requires a higher yield to compensate.
- MBS demand and liquidity: When the Fed buys mortgage-backed securities, rates drop. When it stops or reverses those purchases, rates rise.
- Lender operational capacity: During refinancing booms, lenders can afford to raise rates slightly because demand exceeds their processing bandwidth.
Understanding these mechanics helps explain why a Fed rate cut doesn’t automatically lower your mortgage rate the following week. Markets often price in anticipated cuts before they happen, and long-term yields can rise even as short-term policy rates fall.
What Today’s Rates Mean for Buyers, Refinancers, and Those Waiting
This is where mortgage rate history becomes a practical tool rather than a history lesson. The buyers who use rate history well aren’t those who memorize numbers; they’re the ones who stop chasing a perfect rate and start building a strategy around what’s real.
Rate Timing Is Not the Same as Rate Strategy
History shows clearly that buyers who waited for rates to drop often watched home prices climb faster than their rate savings could offset. According to S&P/Case-Shiller national home price data, when rates fell to sub-3% in 2020, 2021, national home prices surged roughly 37% between March 2020 and March 2022, erasing a significant portion of the monthly payment benefit. Today’s environment pairs rates near 7% with tight inventory and prices that remain elevated because sellers who locked in 3% mortgages aren’t selling. Waiting for a perfect rate has never been a reliable strategy. The buyers who build wealth through real estate buy at the right price for their financial situation, at rates that work for their current budget, and refinance when conditions improve.
How to Use Mortgage Rate History as a Decision-Making Tool
The smartest approach isn’t market timing; it’s scenario modeling. That means understanding your purchasing power at current rates, mapping out payment scenarios across a realistic rate range, identifying your refinancing trigger point, and choosing a loan structure that fits your financial profile today while leaving you room to optimize later. At Isabelle Mortgages, this is exactly how every client conversation starts: with the full historical context placed on the table, and then a strategy built around the life you actually want to live. The framework is the same regardless of where you’re starting from, know the numbers, know your position, then act with clarity.
Making Your Move with Clear Eyes
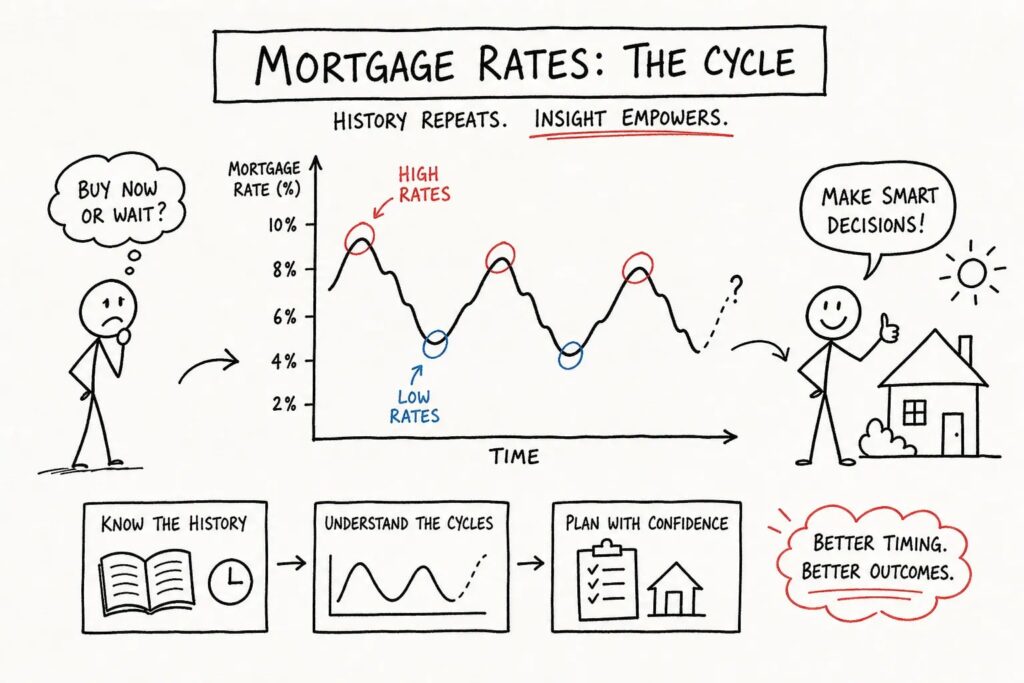
Mortgage rate history is one of the most powerful tools available to anyone buying, selling, or refinancing a home, not because it predicts the future, but because it reframes the present. Rates near 7% feel difficult after 2021’s generational lows, but they sit within a historically recognizable range. The 16.64% peak of 1981 and the 2.96% trough of 2021 bracket an enormous spectrum of economic conditions, and neither extreme defines what “normal” looks like over a full cycle.
The forces that drive rates, Treasury yields, inflation expectations, Fed policy, MBS spreads, lender capacity, are knowable. They follow patterns that mortgage professionals track closely. And understanding them changes how you make decisions: with less panic, less paralysis, and more confidence in your own position.
Mortgage rate history explained is ultimately about perspective. If you’re working through whether now is the right moment to buy, refinance, or wait, the answer isn’t in a rate headline. It’s in a conversation with someone who understands both the numbers and your goals. The team at Isabelle Mortgages is ready to walk you through exactly that. Reach out, let’s talk through what today’s rate environment means specifically for you.