If you’ve ever wondered how much money you lose renting long-term, the answer is almost certainly larger than you expect. Every rent check you write makes someone else wealthier. That’s not an opinion or a scare tactic. It’s just math. And most renters never sit down to run the actual numbers, which is exactly why the gap between renters and homeowners quietly grows year after year, decade after decade.
Renting feels safe. It feels flexible. No maintenance headaches, no down payment required, no long-term commitment. Those are real advantages for certain seasons of life. But flexibility has a price, and that price compounds over time in ways most people seriously underestimate. When you finally look at the scale of wealth left on the table, the numbers are staggering.
At Isabelle Mortgages, we talk to people every single day who assumed homeownership was out of reach, only to discover it wasn’t. The purpose of this article isn’t to shame anyone for renting. It’s to put real dollar figures on the long-term renting losses so you can make a fully informed decision about what comes next.
What Your Monthly Rent Is Actually Paying For
Your Landlord’s Investment Return, Funded by You
Consider a landlord who owns a $250,000 rental property. With a net operating income of roughly $16,000 per year, that property carries a cap rate of approximately 6.4%. On a 25% down payment plus closing costs, a total cash investment of around $70,500, the cash-on-cash return in year one is about 1.48%. Those numbers might not sound dramatic, but they don’t tell the whole story.
The property is also appreciating. U.S. homes have historically gained roughly 4% in value annually over long periods, based on Federal Housing Finance Agency price index data spanning several decades. On a $250,000 asset, that’s $10,000 in added value each year, value the landlord earns simply by holding the property. Your rent check is the engine that runs the entire operation: it covers the mortgage, the taxes, the insurance, and the management fees. The landlord builds equity and watches the asset grow, and you fund every bit of it.
The Equity You’re Building Versus the Equity Your Landlord Is Building
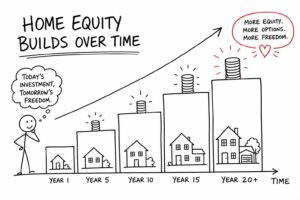
Every mortgage payment a homeowner makes chips away at the loan balance. Think of it as forced savings: money that used to count as a “housing expense” gradually converts into owned asset value. By year 30, that entire loan is gone and the homeowner holds the property outright.
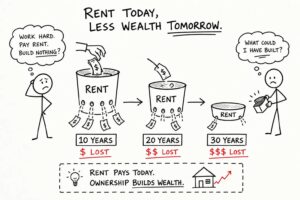
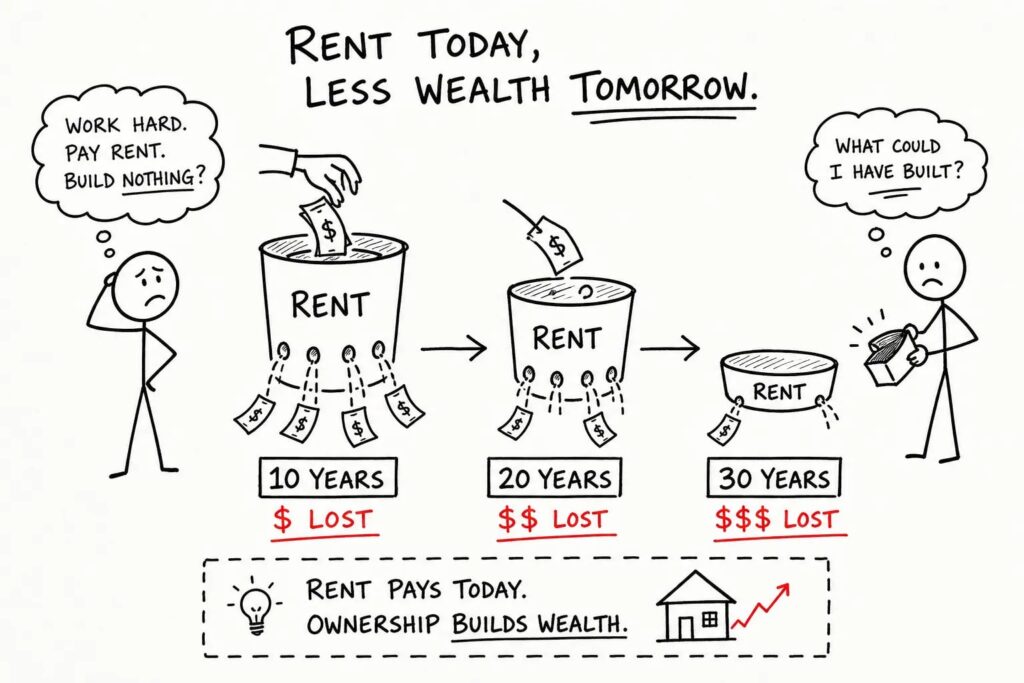
Renters have no equivalent mechanism. Every dollar paid in rent disappears into someone else’s operating expenses, mortgage paydown, and investment return. When a renter writes a check on the first of the month, that money is gone permanently, with zero conversion to ownership, zero equity, and nothing to pass on to the next generation.
How Much Money You Lose Renting Long-Term: The Raw Numbers
Running the Total at Current Rent Levels
The typical U.S. rent in 2026 sits around $1,932 per month, according to recent national rental market data. Using a conservative $2,000 starting point and a 3% annual increase, well within the historical norm, here’s what cumulative rent payments look like over time:
| Time Period | Cumulative Rent Paid | Equity Owned |
|---|---|---|
| 10 years | ~$276,000 | $0 |
| 20 years | ~$643,000 | $0 |
| 30 years | ~$1,140,000 | $0 |
Methodology note: Cumulative rent figures assume a $2,000 starting monthly rent compounded at 3% annually. Equity column reflects renter position only; homeowner equity projections appear in the comparison table below.
At the end of 30 years, every dollar in that table belongs to a landlord or a property management company. The renter has no asset, no equity, and no financial legacy from three decades of housing payments. Over $1 million in housing costs, and nothing to show for it. That’s the core of how much money you lose renting long-term.
What Rent Increases Do to Your Budget Over Decades
At 3% annual growth, a $2,000 rent in 2026 becomes roughly $2,700 by year 15 and nearly $3,600 by year 30. Those increases happen on someone else’s timeline and for someone else’s financial benefit. The renter has no say in it.
A homeowner with a fixed-rate mortgage faces a completely different reality. Their principal-and-interest payment is locked in at closing and never moves for 30 years. That payment certainty is itself a form of financial protection, one of the most underappreciated advantages of homeownership. While the renter’s housing cost quietly inflates every year, the homeowner’s stays flat. The concept of negative cash flow rental is something landlords worry about; renters simply absorb whatever increases the market allows.
What Homeowners Gain While Renters Pay
Equity Growth Through Principal Paydown
On a 30-year fixed mortgage for a $300,000 home with a 5% down payment at a 7% rate, the equity picture builds steadily. By year 10, the borrower has paid down roughly $35,000 to $40,000 in principal. By year 20, that figure climbs above $90,000. By year 30, the entire loan is retired.
Meanwhile, a renter paying a comparable monthly amount has paid an equivalent or greater sum in rent. None of it converts to ownership. The homeowner’s housing expense is partially an investment; the renter’s is entirely a cost.
Home Appreciation: The Multiplier Renters Miss Entirely
Layer appreciation on top of principal paydown and the wealth gap becomes even more striking. Using a 4% annual appreciation rate on a $300,000 home, the asset trajectory looks like this:
- After 10 years: approximately $445,000
- After 20 years: roughly $657,000
- After 30 years: close to $973,000
The homeowner earns that appreciation on the full value of the property, not just on their down payment. That’s leveraged appreciation, and most people never access it because they’re renting.
The renter who lived in a similar home and paid a similar monthly amount earns exactly none of that appreciation. They experienced the same housing market. They just didn’t own any of it.
The 10, 20, and 30-Year Wealth Gap: Long-Term Renting Losses by the Numbers
A Side-by-Side Comparison That Tells the Whole Story
Here’s what the renter-versus-homeowner picture looks like when you line it up directly, using a $300,000 home purchased with a 5% down payment, a 7% fixed rate, and 4% annual appreciation:
| Year | Renter: Cumulative Housing Cost | Renter: Net Asset Value | Homeowner: Estimated Equity |
|---|---|---|---|
| 10 years | ~$276,000 | $0 | ~$175,000, $200,000 |
| 20 years | ~$643,000 | $0 | ~$450,000, $560,000 |
| 30 years | ~$1,140,000 | $0 | ~$900,000, $1,300,000+ |
Homeowner equity estimates combine principal paydown and 4% annual appreciation. Ranges reflect variability in local market conditions, landlord expenses, and vacancy rate scenarios that affect rental property profitability but not the renter’s position.
By year 30, the homeowner may hold a fully paid or nearly paid asset worth close to seven figures, while the renter has paid over a million dollars in housing costs and owns nothing. That’s not a small gap. It’s a generational one.
Why Starting 5 Years Earlier Changes Everything
The cost of delay is real and measurable. Someone who buys at age 30 instead of 35 may accumulate $100,000 to $200,000 more in equity and appreciation by retirement, simply because compounding had more time to run. Delay is not neutral. Every month spent renting while waiting to “be ready” is a month the clock isn’t running in your favor.
Why Renters Feel Stuck, and Why the Barriers Are Smaller Than Expected
The Down Payment Myth
The single most common reason renters stay renters is the belief that they need 20% down to buy a home. They don’t. FHA loans allow down payments as low as 3.5%. Conventional loan programs go as low as 3%. Down payment assistance programs exist in virtually every U.S. state, offering grants, forgivable loans, and deferred second mortgages to qualifying buyers.
On a $300,000 home, 3.5% down is $10,500. That’s a number many renters either already have in savings or can reach within 12 to 18 months with a focused plan. The wall that seems to separate renters from ownership is much shorter than it looks from the outside.
Credit and Income Concerns: What Lenders Actually Look For
Renters with non-traditional income, 1099 contractors, self-employed entrepreneurs, small business owners, often assume the mortgage door is closed to them. It isn’t. Bank statement loans, DSCR products, and other alternative qualification paths exist specifically for borrowers who don’t have standard W-2 documentation. FHA minimum credit scores start around 580 for 3.5% down financing. Many first-time buyer programs are built for people who don’t have perfect financial profiles.
The qualification bar is more accessible than most renters assume, especially when you’re working with a lender who understands complex financial situations and knows how to structure the right solution. Understanding your rental property profitability options as a future owner starts with knowing what you can qualify for today.
From Renter to Homeowner: Where to Start Right Now
The First Three Moves That Matter
The path from renter to owner doesn’t require everything to be perfect before you begin. Start by pulling your credit report and identifying any quick-win fixes. Paying down a revolving balance or disputing an old error can move your score meaningfully in 60 to 90 days. Next, calculate your true monthly budget: what you currently pay in rent plus utilities gives you a realistic baseline for what a mortgage payment would need to look like.
The third move is the most clarifying: get a mortgage pre-approval. Pre-approval is not a commitment to buy anything. It’s a reality check that tells you exactly where you stand, what you qualify for, and what your actual path to closing looks like. Most people who go through this step are surprised, in a good way, by what’s within reach.
How Isabelle Mortgages Helps Renters Make the Transition
Isabelle Mortgages was built specifically for people at this crossroads. Through the Gen-First Mortgage Method™, the team guides first-generation buyers, self-employed borrowers, and families who have been renting for years through every step of the process, from application to closing. That means one-on-one guidance, bilingual support in English and Spanish, transparent communication throughout, and a genuine personal investment in each client’s outcome.
The goal was never just to close loans. It was to help families stop funding someone else’s wealth and start building their own. If you’re ready to make that shift, reach out to the team at Isabelle Mortgages to find out exactly how close you are to the finish line.
The 30-Year Cost of Waiting
Over 30 years, the cost of renting long-term, when you account for equity, appreciation, and the rent that never converts into anything owned, can exceed $700,000 to $1 million in lost wealth compared to a homeowner in the same market. That gap doesn’t happen because homeowners are smarter or luckier. It happens because they made one decision at some point and started the clock.
Every month spent renting, the math runs in the wrong direction. If you want to stop losing money renting long-term and start building equity, the first step is a conversation with a lender who understands where you’re starting from and can show you what the next step actually looks like. The numbers are already moving. The only question is which direction they’ll move for you.