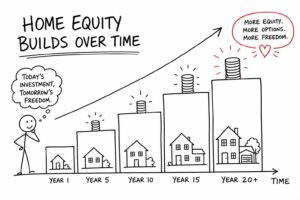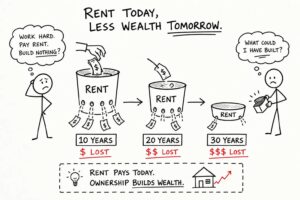
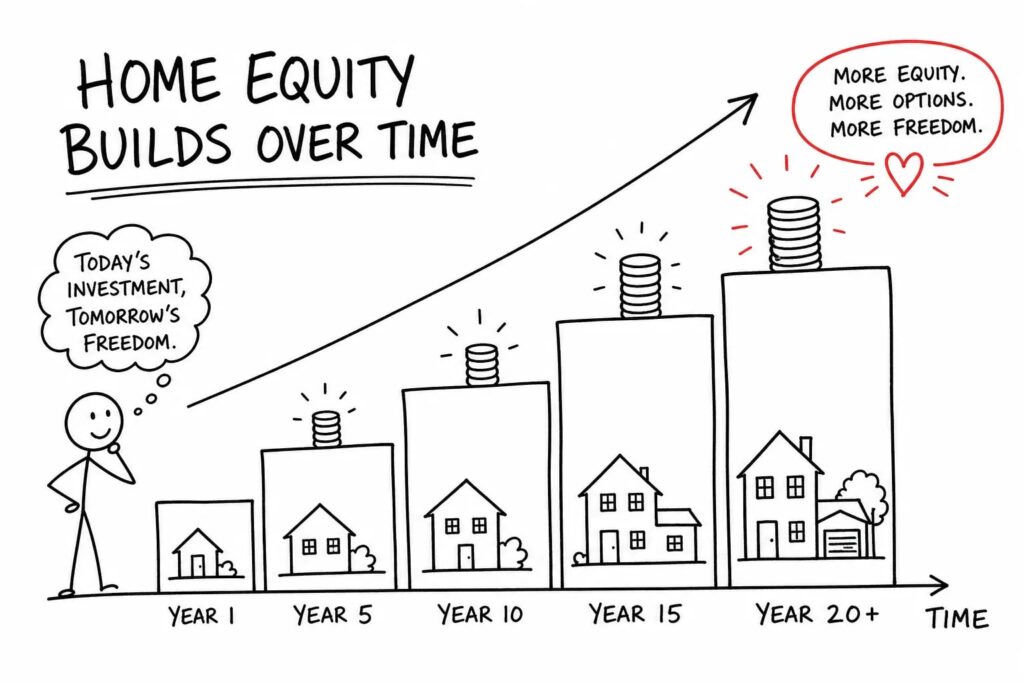
If you’re wondering how much equity you build owning a home, the answer starts the moment you make your first mortgage payment. Two things happen at once: a portion pays the interest your lender charges, and the other portion chips away at the balance you owe. Most buyers focus entirely on whether they can afford the monthly number and miss the wealth-building process running underneath every single payment.
The problem is that most homeowners don’t actually know how to read their equity growth. They make payments for years, assume things are moving in the right direction, but can’t tell you their current equity position, how fast it’s building, or what they could do with it right now.
At Isabelle Mortgages, this is the conversation we have with every client before they sign a loan, because the loan structure chosen on day one directly shapes how fast equity accumulates for the next 30 years. This article gives you the formula, the real numbers, and the decisions that change the outcome.
The simple formula for calculating your home equity
What the formula actually measures
Home equity is the difference between your home’s current market value and the total outstanding debt secured by the property. That debt includes your first mortgage, any second mortgage, a HELOC balance, and any other liens against the home. Every one of those balances counts against your equity position.
The key word is “current.” You use what the home is worth right now, not the price you paid years ago, because those two numbers diverge significantly over time. A simple example: a $500,000 home with a $300,000 remaining mortgage carries $200,000 in equity, regardless of the original purchase price.
Expressing equity as a percentage
Lenders don’t just look at the dollar figure. They look at the percentage of the home’s value you actually own. The equity calculation is simple: divide your home equity by the current home value, then multiply by 100.
Here’s how that plays out with a HELOC in the picture. If your home is worth $450,000, your first mortgage balance is $215,000, and your HELOC balance is $35,000, your total debt is $250,000. Your equity is $200,000, which works out to 44.4% of the home’s value. That percentage is what lenders use to determine your borrowing eligibility, whether PMI can be removed, and which loan options are available to you.
How much equity you build owning a home: loan structure from day one
30-year vs. 15-year: how fast equity builds
As of October 2026, according to Freddie Mac, a 30-year fixed mortgage averages about 7.4% and a 15-year fixed averages about 6.7%. Those rates sound close, but the difference in how equity builds is significant.
On a $300,000 loan, the 30-year option runs about $2,073 per month and costs roughly $446,000 in total interest over the full term. The 15-year option costs about $2,655 per month but saves approximately $267,000 in interest. More importantly, the 15-year borrower builds equity faster in the early years, not just because the timeline is shorter, but because the lower rate means more of every payment goes toward principal from the very first check. To put numbers on it: after five years on the 15-year loan, cumulative principal paid approaches $65,000 on a $300,000 balance, compared to roughly $20,000 on the 30-year. This is precisely the kind of structural decision the Gen-First Mortgage Method at Isabelle Mortgages helps buyers work through before they commit to a loan.
Why the interest rate you lock in matters for equity
A higher rate doesn’t just raise your monthly payment. It changes how that payment is divided between interest and principal. At 6.5% on a $400,000 loan, the first payment contains roughly $362 in principal, the rest goes to the lender as interest. Over the entire first year, you pay down only about $4,362 of the balance.
Getting the right rate at closing isn’t just about what you pay each month. It determines how much of the home you actually own after year 5, year 10, and year 20. A rate difference of even half a percentage point shifts thousands of dollars from interest into your equity column over a decade. For example, on a $400,000 loan, moving from 7.0% to 6.5% redirects more than $10,000 in additional principal reduction over the first 10 years alone.
How much equity you build owning a home through mortgage paydown
Why the first years feel slow: the amortization curve
Early mortgage payments are front-loaded with interest because the balance is at its highest point. This is how mortgage principal vs. interest shifts over time on a $400,000 loan at 6.5%: the principal paid after year 1 is about $4,362. After year 5, it reaches roughly $24,693. After year 10, it climbs to about $57,855.
In year 1, you’ve reduced the original balance by just 1.1%. By year 10, that share reaches 14.5%. The payment itself doesn’t change, but the interest charge shrinks every month as the balance falls. The principal portion naturally accelerates over time, which is why equity from paydown picks up momentum the longer you stay.
When paydown momentum picks up
Here’s a clear picture of how principal reduction stacks up over time on a $400,000 loan at 6.5%:
| Year | Cumulative principal paid | Remaining balance |
|---|---|---|
| 1 | $4,362 | $395,638 |
| 5 | $24,693 | $375,307 |
| 10 | $57,855 | $342,145 |
| 20 | ~$179,300 | ~$180,700 |
By year 20, the cumulative principal paid is more than double what it was at year 10. That compounding momentum is one reason staying in a home longer, or making extra principal payments along the way, produces results that seem disproportionate to the effort involved.
How appreciation multiplies your equity over time
What realistic appreciation looks like nationally
Over the long run, U.S. home prices have appreciated at roughly 3.4% to 4% annually in nominal terms, according to Federal Housing Finance Agency data. The pandemic surge of 8% to 9% annually from 2019 through 2024 is not a reasonable number to project forward. For planning purposes, three scenarios cover the realistic range: 2% for a conservative or soft market, 3.5% as the base case, and 5% for a strong local market with supply constraints.
On a $400,000 home over 10 years, those assumptions produce very different results. At 2% annual appreciation, the home reaches about $487,600. At 3.5%, it’s roughly $564,800. At 5%, it reaches approximately $651,600. The spread between those outcomes exceeds $160,000, which is why your appreciation assumption matters as much as your loan structure.
Combined equity snapshot: paydown plus appreciation
When you add paydown and appreciation together on a $400,000 home with a 10% down payment and a $360,000 loan at 6.5%, using a 3% annual appreciation rate, the combined equity picture at key milestones looks like this:
| Year | Estimated home value | Mortgage balance | Total equity |
|---|---|---|---|
| 5 | $463,700 | $336,200 | $127,500 |
| 10 | $537,600 | $299,200 | $238,400 |
| 20 | $722,400 | $180,700 | $541,700 |
Neither engine works as powerfully alone as they do together. Paydown alone moves slowly in the early years. Appreciation alone doesn’t reduce what you owe. Compounded over two decades, the combination converts a $40,000 down payment and regular monthly payments into over half a million dollars in equity.
What reaching the 20% equity threshold actually unlocks
How lenders calculate how much you can borrow
Most lenders cap your combined loan-to-value ratio (CLTV) at 80% to 85% of the home’s appraised value when you want to tap equity through a HELOC or home equity loan. Your maximum available borrowing is calculated as: (appraised value multiplied by the maximum CLTV) minus the existing mortgage balance.
Using a $400,000 home with an 85% CLTV cap and a $200,000 first mortgage: $400,000 times 0.85 equals $340,000, minus $200,000 leaves a theoretical $140,000 available. Actual approval also depends on credit score, income verification, and your debt-to-income ratio. The equity percentage is the gateway that determines whether that option is even on the table.
HELOC vs. home equity loan: choosing the right tool
A HELOC is a revolving credit line, which works well for projects or costs that unfold over time with variable timing. A home equity loan delivers a lump sum with a fixed rate and fixed payment, which is better when you have a defined expense like a renovation budget or a tuition bill. Both products require you to meet an equity threshold, though lenders’ specific CLTV minimums and underwriting rules can vary between product types and by lender, so it’s worth confirming requirements directly before you apply.
Reaching 20% equity also triggers PMI removal eligibility on conventional loans. Under federal law, you can request PMI cancellation once you reach 20% equity, typically requiring a borrower request and, in some cases, a current appraisal. Eliminating PMI drops your monthly payment without refinancing, a direct, immediate benefit worth tracking toward from the day you close. On a $300,000 loan, PMI typically runs $100 to $200 per month, so the savings add up quickly once you hit that threshold.
How to accelerate equity growth starting today
Practical moves that speed up equity build-up
One of the most effective approaches is adding one extra full payment per year, applied directly to principal. On a 30-year fixed mortgage, that single extra payment annually typically shaves four to six years off the loan term and redirects tens of thousands of dollars from interest into equity. (Results will vary based on your rate and when you start; confirm with your servicer that the extra payment is applied to principal.) A lower-commitment version of the same strategy is rounding up the monthly payment: paying $2,100 instead of $2,073 every month adds up to meaningful principal reduction over time without straining the monthly budget.
Refinancing from a 30-year to a 15-year when rates allow is the most aggressive option, provided the income supports the higher payment and the rate reduction makes the math work. A larger down payment at purchase immediately raises your equity percentage, and coming in above 20% down eliminates PMI from day one, keeping more of every payment working toward your balance rather than covering insurance.
Starting with the right loan structure from day one
The single most impactful equity decision most buyers make is the one they make before closing: which loan type, which term, and which rate they accept. Every variable set at the closing table shapes how much equity you hold five, ten, and twenty years later. Changing course after closing costs money in refinancing fees and lost time.
The Gen-First Mortgage Method at Isabelle Mortgages is built around exactly this: aligning the loan structure with your equity goals, monthly cash flow, and long-term wealth plan before you sign anything. Whether you’re buying your first home or managing a more complex financial picture, the right structure today determines how much your home works for you tomorrow. Reach out to Isabelle Mortgages to run your personal equity projection before you choose a loan, the numbers are available before you commit, not just after.
Your equity is not on autopilot
Understanding how much equity you build owning a home starts with recognizing that it’s shaped by every structural decision you make: the loan term, the rate, the down payment, and whether you apply extra principal along the way. The buyers who understand those levers build equity faster and have more options when they need them.
Two engines drive equity growth. Amortization starts slowly and accelerates through the back half of the loan, each payment quietly compounding the gain. Appreciation compounds on an asset you control with borrowed money, growing your stake in a property you don’t fully own yet. Together, they produce results neither would achieve alone.
Hitting 20% equity is not the finish line, it’s the starting line for what equity can do for you, whether that means eliminating PMI, opening a credit line for your next move, or refinancing into better terms. If you’re buying soon or already own and want to know exactly where you stand, the team at Isabelle Mortgages can walk you through your personal equity timeline before you make your next decision.